Grocery price inflation in the U.S. continued to cool in the first quarter of 2025, with a few tariff-related exceptions, according to data from Catalina’s robust, real-time Shopper Intelligence Platform. Catalina’s Shopping Basket Index (SBI), which tracks the aggregate average price changes of 10 common grocery product categories, reveals an overall inflation rate of 2% in Q1 2025 compared to the same period in 2024. This marks a drop from the 3% recorded in Q1 2024 versus Q1 2023, and a dramatic decrease from the full-year 2023 average of 16%, as tracked by Catalina’s SBI.
“Overall, inflation continues to ease across most categories and the cost of Frozen Foods has dropped below 2024 prices,” said Adam Van Beck, Catalina’s SVP of Omnichannel Solutions, Digital and In-Store Commerce. “However, we’re seeing early indicators that CPG marketers are preparing for tariff-related cost increases on imported raw materials such as coffee beans and aluminum for soft drink cans.”
Category-specific Inflation Trends
Data from Catalina’s Shopper Intelligence Platform reveals 6 of the 10 tracked categories are currently at or below the SBI’s 2% average inflation rate. This is slightly lower than the overall 2.4% inflation rate for Food at Home reported in the March 2025 US Consumer Price Index (CPI). An 8% increase in the price of the CPI’s Meats, Poultry and Eggs category was offset by a drop in Fruit and Vegetable prices, and a 1% increase in the cost of Cereal and Bakery products.
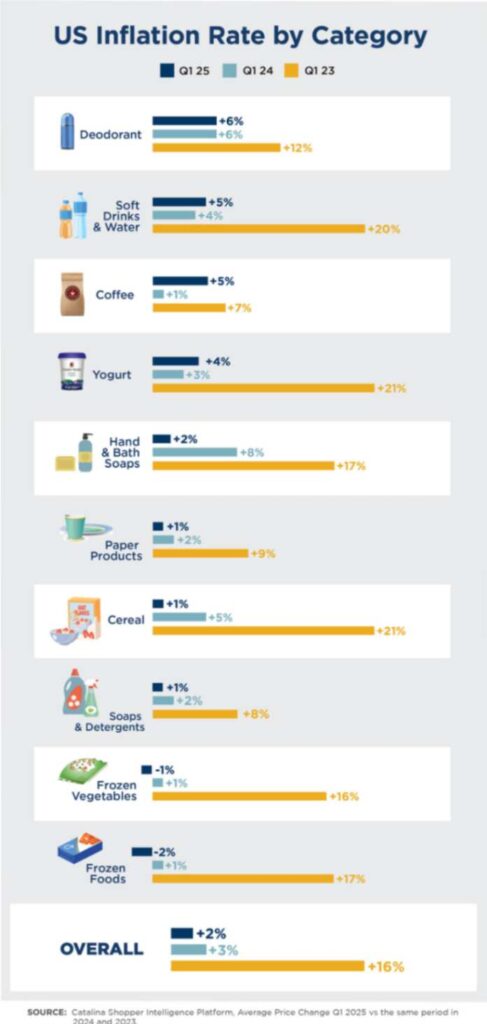
Rising Prices: At 6% YOY, Deodorant prices remain higher than the average inflation rate, according to Catalina’s Shopping Basket Index. Coffee and Soft Drinks prices also saw significant increases of 5% YOY, while Yogurt prices rose 4% during the same period.
Flat or Declining Prices: The price of Hand & Bath Soaps has fallen significantly since the height of inflation in 2023 when they were at an inflation rate of 17% versus 2% today. Cereal, Paper Products, and Soaps & Detergents all posted one percent inflation for Q1 2025, according to Catalina’s SBI, while Frozen Vegetable and Frozen Prepared Foods prices fell -1% and -2% respectively.
US Inflation Rate by Category – Q1 2025 vs. Q1 2024 vs. Q1 2023
| Category | Q1 2025 | Q1 2024 | Q1 2023 |
| Deodorants | 6 % | 6 % | 12 % |
| Soft Drinks & Water | 5 % | 4 % | 20 % |
| Coffee | 5 % | 1 % | 7 % |
| Yogurt | 4 % | 3 % | 21 % |
| Hand & Bath Soaps | 2 % | 8 % | 17 % |
| Cereal | 1 % | 5 % | 21 % |
| Paper Products | 1 % | 2 % | 9 % |
| Soaps & Detergents | 1 % | 2 % | 8 % |
| Frozen Vegetables | -1 % | 1 % | 16 % |
| Frozen Prepared Foods | -2 % | 1 % | 17 % |
| OVERALL | 2 % | 3 % | 16 % |
Source: Catalina Shopper Intelligence Platform Average Price Change Q1 2025 vs same period 2024, 2023 & 2022


