
Best Buy Co., Inc. (NYSE: BBY) today announced results for the 13-week second quarter ended July 29, 2023, as compared to the 13-week second quarter ended July 30, 2022.
“Today we are reporting second quarter sales results that are at the high-end of the outlook we shared in May and profitability that was better than expectations,” said Corie Barry, Best Buy CEO. “These results continue to demonstrate our strong operational execution as we balance our reaction to the current industry sales pressure with our ongoing strategic investments.”
“Our financial results were better than expected, and they reflect a consumer electronics industry that remains challenged due to the pull-forward of demand in prior years and the various macroeconomic factors that we are all too familiar with,” Barry continued. “With that said, we continue to expect that this year will be the low point in tech demand after two years of sales declines. Next year the consumer electronics industry should see stabilization and possibly growth driven by the natural upgrade and replacement cycles and the normalization of tech innovation. I am very proud of the way our teams are managing the business and preparing for our future, and we remain incredibly excited about our future opportunities.”
FY24 Financial Guidance
“In May, we noted that we were preparing for a number of scenarios within our annual guidance range, and we believed our sales were aligning closer to the midpoint of the annual comparable sales guidance,” said Matt Bilunas, Best Buy CFO. “Today we are lowering the high-end of our full year revenue outlook to our previous midpoint, while keeping the low-end of our revenue guidance unchanged. At the same time, we are narrowing our profitability ranges, effectively raising the midpoint of our previous annual guidance for non-GAAP operating income rate and non-GAAP diluted EPS.”
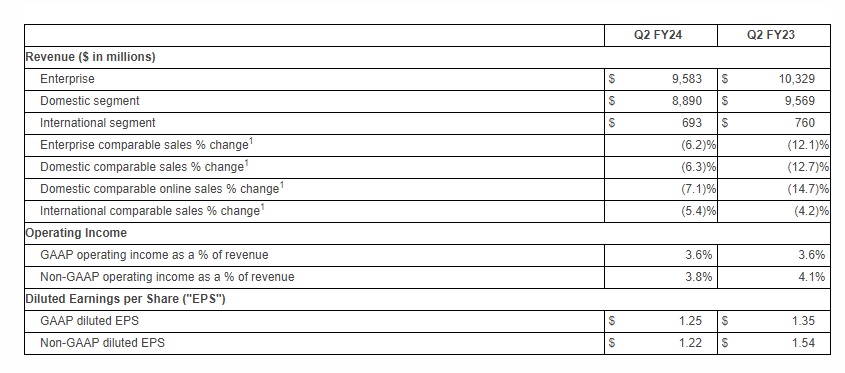
Bilunas continued, “As it relates specifically to the third quarter, we expect our comparable sales to be slightly better than the negative 6.2% we reported for the second quarter and our non-GAAP operating income rate to be approximately 3.4%.”
Best Buy’s guidance for FY24, which includes 53 weeks, is the following:
- Revenue of $43.8 billion to $44.5 billion, which compares to prior guidance of $43.8 billion to $45.2 billion
- Comparable sales decline of 4.5% to 6.0%, which compares to prior guidance of a decline of 3.0% to 6.0%
- Enterprise non-GAAP operating income rate2 of 3.9% to 4.1%, which compares to prior guidance of 3.7% to 4.1%
- Non-GAAP effective income tax rate2 of approximately 24.5%, which remains unchanged
- Non-GAAP diluted EPS2 of $6.00 to $6.40, which compares to prior guidance of $5.70 to $6.50
- Capital expenditures of approximately $850 million, which remains unchanged
Note: Incorporated in the above guidance, the 53rd week is expected to add approximately $700 million of revenue to Q4 FY24 and provide a benefit of approximately 10 basis points to the company’s full year non-GAAP operating income rate.2
Domestic Segment Q2 FY24 Results
Domestic Revenue
Domestic revenue of $8.89 billion decreased 7.1% versus last year primarily driven by a comparable sales decline of 6.3%.
From a merchandising perspective, the largest drivers of the comparable sales decline on a weighted basis were appliances, home theater, computing and mobile phones. These drivers were partially offset by growth in gaming.
Domestic online revenue of $2.76 billion decreased 7.1% on a comparable basis, and as a percentage of total Domestic revenue, online revenue was flat to last year at 31.0%.
Domestic Gross Profit Rate
Domestic gross profit rate was 23.1% versus 22.0% last year. The higher gross profit rate was primarily due to: (1) favorable product margin rates; (2) improved financial performance from the company’s membership offerings, which included higher services margin rates and reduced costs associated with program changes made to the company’s free membership offering; and (3) an improved gross profit rate from the company’s Health initiatives.
Domestic Selling, General and Administrative Expenses (“SG&A”)
Domestic GAAP SG&A was $1.73 billion, or 19.5% of revenue, versus $1.73 billion, or 18.1% of revenue, last year. On a non-GAAP basis, SG&A was $1.71 billion, or 19.2% of revenue, versus $1.71 billion, or 17.9% of revenue, last year. Both GAAP and non-GAAP SG&A were approximately flat to last year, as higher incentive compensation was primarily offset by reduced store payroll expense.
International Segment Q2 FY24 Results
International revenue of $693 million decreased 8.8% versus last year. This decrease was primarily driven by a comparable sales decline of 5.4% and the negative impact of approximately 340 basis points from foreign currency exchange rates.
International operating income was $19 million, or 2.7% of revenue, compared to $28 million, or 3.7% of revenue, last year. The lower operating income rate was primarily driven by SG&A deleverage on lower revenue, which was partially offset by an improvement in the company’s gross profit rate of approximately 80 basis points compared to last year.
Income Taxes
The Q2 FY24 GAAP effective tax rate was 26.1% versus 15.6% last year. On a non-GAAP basis, the effective tax rate was 26.6% versus 16.7% last year. The lower GAAP and non-GAAP effective tax rates last year were primarily due to the resolution of certain discrete tax matters.


