Skai, an omnichannel platform for performance marketing, has published its Q2 2022 Digital Marketing Quarterly Trends Infographic, an in-depth analysis of the digital marketing trends that defined the last quarter (Q2). Overall, spending increased in all channels compared to both last quarter and last year.
Overall spending growth continues
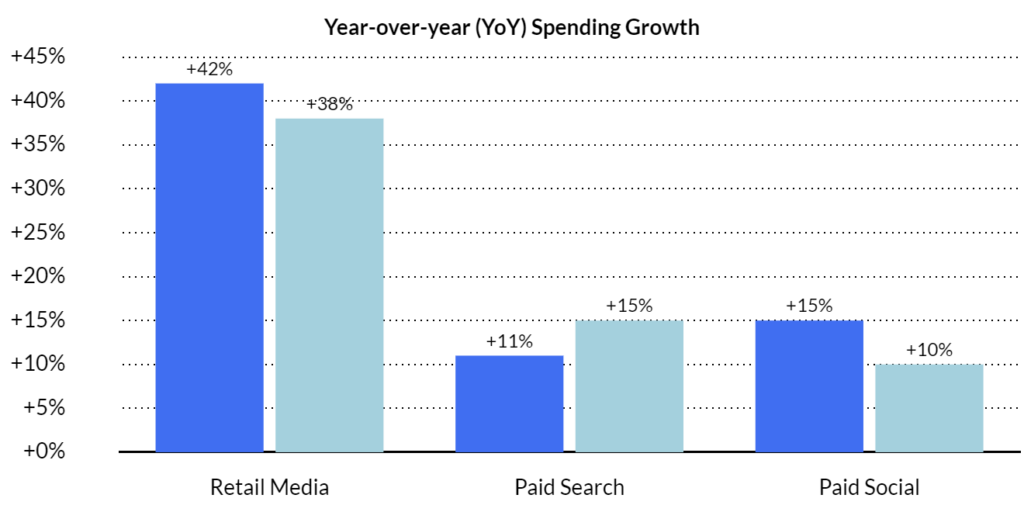
Retail media growth accelerated 42% year over year (YoY) in Q2 as advertisers continued to grow spending both on Amazon and the ever-increasing field of other retail media networks. Paid social media spending growth grew 15%, as 2022 has proved a more stable spending environment than the same period last year, which was disrupted by increased user privacy controls on Apple mobile devices. Paid search spending increased 11% YoY.

Shopping a big factor across channels
Retail media growth was, by definition, driven by more brands trying to reach a larger group of shoppers while they are in-market. Paid social spending growth in the quarter also benefited from investment on commerce-focused ad types and from commerce-focused advertisers. It was only in paid search where investment appeared to follow the macroeconomic trend away from goods and toward services.
Social advertisers are adjusting to IDFA
2021 saw sequential spending declines from April to May to June as the release of iOS 14.5 introduced changes to privacy controls and availability of data for both targeting and measurement. With a myriad of solutions and workarounds in place for these disruptions this year, monthly spending in paid social media has been much more stable in 2022, paving the way for an acceleration of growth.
Responsive Search Ads now dominate search spend
The migration of paid search from the Expanded Text Ad (ETA) format to the Responsive Search Ad (RSA) format has reached the point where RSA is now dominant, comprising 38% of total Q2 spend compared to just 23% in the second quarter last year. ETA spend has dropped from 40% to 27% of spend over that same time period, with shopping ads making up most of the balance.
Other quarter-over-quarter (QoQ) and YoY findings include:
| Channel | Metric | QoQ Change | YoY Change |
| Retail Media | Impressions | +18 % | +33 % |
| Clicks | +19 % | +44 % | |
| Cost-per-click (CPC) | -2 % | -1 % | |
| Paid Search | Impressions | +2 % | +15 % |
| Clicks | -1 % | +3 % | |
| CPC | +4 % | +8 % | |
| Paid Social | Impressions | +6 % | +15 % |
| Clicks | +2 % | +2 % | |
| Cost per thousand impressions (CPM) | +9 % | 0 % |
“This quarter has been defined by how advertisers are reaching shoppers, and that’s through a mindful mix of walled garden channels,” said Chris Costello, Senior Director of Marketing Research at Skai. “Commerce advertisers and brands have increased investment in social media to stimulate demand, then continued to grow their advertising presence at the very bottom of the funnel with retail media spending, where purchase intent is strongest. Meanwhile, we see more direct evidence of how social media advertising has adapted and rebounded versus the second quarter last year, when the introduction of IDFA led to decreasing social budgets. This year, solutions to the loss of targeting and measurement signals have helped stabilize those spending levels, which has yielded stronger growth for social media spending than many expected.”
Methodology
Analysis is drawn from a population of approximately $9 billion in advertising spend over five quarters, comprising more than 3,000 advertiser and agency accounts across 40 vertical industries and more than 150 countries running on the Skai™ platform on Google, Microsoft, Baidu, Yandex, Yahoo! Japan, Verizon Media, Amazon, Walmart, Instacart, Criteo, Apple Search Ads, Pinterest, Snapchat, Facebook, and Instagram. Except where noted, only advertisers with 15 consecutive months of performance data are included. Some additional outliers have been excluded. Ad spending and pricing have been translated to USD at the time the spending was incurred, where applicable.


