With COVID-19 vaccination rates up, more restaurants and bars operating at greater capacity, and small numbers of workers returning to the office – even amidst escalating concerns about the Delta variant – shopper behavior continues to shift across multiple categories according to the most recent data pulled from Catalina’s Buyer Intelligence Database.
Retail Sales Trends for Many Alcohol, Diet and Convenience Products Continue Shifting

For the 13 weeks ending Aug. 7, 2021, which corresponds with more restaurants and bars reopening or returning to greater capacity, retail sales of domestic beer were down 9%, imported beer dropped 6%, and craft beer was down 9%. Bucking the trend, non-alcoholic beer increased by 24%. Meanwhile, domestic wine sales declined by 11%, imported wine by 13% and boxed wine by 11%. Spirits experienced a decline of 10% overall, though premixed cocktails increased by 34%. Also up were canned wine (+5%), hard seltzers (+5%) and low alcohol, “better for you” wines, which surged 356%.
Of note, sales in all alcohol categories are up vs. the same period in 2019 (pre-pandemic)
| BEER: -9% Overall | WINE: -11% Overall | SPIRITS: -10% Overall |
| – Domestic: -9% | – Domestic: -11% | |
| – Imported: -6% | – Imported: -13% | |
| – Craft: -9% | – Boxed: -11% | |
| NON-ALCOHOLIC BEER: +24% | LOW-ALCOHOL WINE: +356% | PRE-MIXED COCKTAILS: +34% |
In general, as some companies began opening their doors to small numbers of workers after more than 17 months of working from home, sales of low-calorie, “diet” and convenience foods started to increase. This suggests that people who may have gained a few pounds while working from home–in close proximity to their kitchens—realized they may soon have to trade stretchy athleisure wear for more traditional, fitted work clothes.

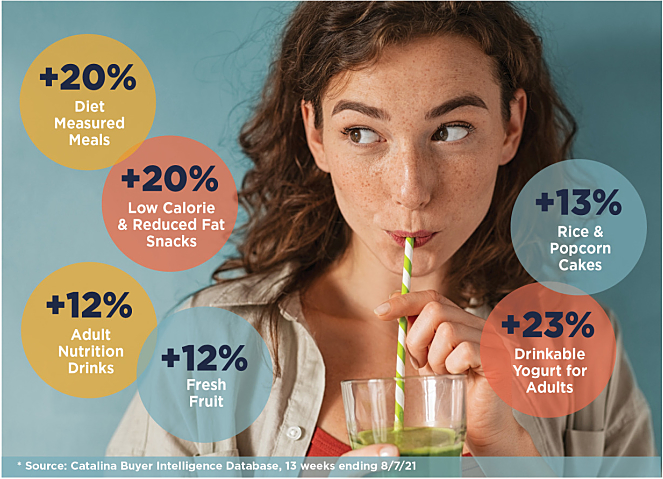
Specifically, sales of low calorie/reduced fat snacks have increased 20%, drinkable yogurt for adults has risen 23%, rice and popcorn cakes are up 13%, diet measured meals/snack bars are up 11%, adult nutrition drinks and fresh fruit are both up 12%, and adult nutrition bars increased 10%. The convenience of many of these products is also important to adults and to kids busy with planned summer activities like camp and sports leagues.
Face Masks Experience Sharp Sales Increase – Again!
With the Centers for Disease Control and Prevention (CDC) changing its previous masking recommendation and now encouraging both vaccinated and unvaccinated individuals to wear face masks in more public settings, sales in this previously declining category have seen a sharp uptick for the week ending Aug. 7, returning to levels last seen in January.
Face mask sales dropped fairly steeply in February as the numbers of vaccinated people started to rise, and more people began getting out and traveling again. While sales were basically flat in March and April, they began to decline again in mid-May, reaching their lowest point the week ending June 26. Over the past four weeks, sales have really taken off again, and are up 232% over the low experienced during the week ending June 26.
“The ongoing pandemic continues to dramatically change shopping behavior. While many thought the world was getting back to normal, reactions to the Delta variant further demonstrate how important accessing real-time data and flexibility are to marketers who need to be ready to swiftly adapt their marketing plans,” said Marta Cyhan, Catalina Chief Marketing Officer.
All sales data was pulled from Catalina’s Buyer Intelligence Database, which captures up to three years of purchase history across the U.S. as well as more than two billion Universal Product Codes.


