NRSInsights, a provider of sales data and analytics drawn from retail transactions processed through the National Retail Solutions (NRS) point-of-sale (POS) platform, today announced comparative retail same-store sales results for November 2025.
As of November 30, 2025, the NRS retail network comprised approximately 38,000 active terminals nationwide, scanning purchases at approximately 32,900 independent retailers, including convenience stores, bodegas, liquor stores, grocers, and tobacco and sundries sellers, predominantly serving urban consumers.
November Highlights
(Same-store sales, unit sales, transactions, and average price data refer to November 2025 and are compared to November 2024 unless otherwise noted. All comparisons are provided on a “per calendar day” basis to remove from consideration variability in the number of days per month or three-month period.)
- SALES
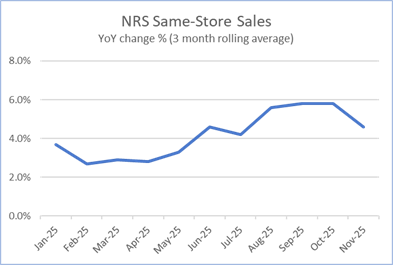
- Same-store sales increased 3.8% year-over-year. In the previous month (October 2025), same-store sales increased 5.7% year-over-year.
- Same-store sales decreased 0.7% compared to the previous month (October 2025). Same-store sales in October 2025 also decreased 0.7% compared to the previous month (September 2025).
- For the three months ended November 30, 2025, same-store sales increased 4.6% compared to the corresponding three months a year ago.
- UNITS SOLD
- Units sold increased 0.9% year-over-year. In the previous month (October 2025), units sold increased 1.3% year-over-year.
- Units sold decreased 0.9% compared to the previous month (October 2025). Units sold in October 2025 decreased 1.8% compared to the previous month (September 2025).
- BASKETS (TRANSACTIONS) PER STORE
- Baskets decreased 0.9% year-over-year. In the previous month (October 2025), baskets increased 0.1% year-over-year.
- Baskets decreased 3.7% compared to the previous month (October 2025). Baskets in October 2025 decreased 2.6% compared to the previous month (September 2025).
- AVERAGE PRICES
- A dollar-weighted average of prices for the top 500 items purchased in November increased 3.1% year-over-year, a slight increase from the 3.0% year-over-year increase in October 2025.
Retail Trade Comparative Data
As a result of the recent government shutdown, U.S. Commerce Department’s Advance Monthly Retail Trade same-store sales data excluding food service for October has not been released.

“NRS’ independent retailer network generated steady momentum in November, with transactions up 0.9% and dollar sales increasing 3.8% versus November a year ago. Growth was driven by continued strong performance in key convenience categories, including cigarettes, RTD cocktails, smokeless tobacco, and energy beverages. Our measure of inflation in November reached 3.1%, its highest level this year and a slight increase from the 3.0% recorded in October. These results highlight the resilience of everyday convenience spending and the value our retailers provide to their local communities,” noted Brandon Thurber, VP, Data Sales & Client Success at NRS.
NRSInsights Reports
The NRSInsights monthly Same-Store Retail Sales Reports are intended to provide timely topline data reflective of sales at NRS’ network of independent, predominantly urban, retail stores.
Same-store data comparisons of November 2025 with November 2024 are derived from approximately 216 million transactions processed through the approximately 24,000 stores on the NRS network that scanned transactions in both months. Same-store data comparisons of November 2025 with October 2025 are derived from approximately 272 million transactions processed through approximately 32,000 stores.
Same-store data comparisons for the three months ended November 30, 2025 with the year-ago three months are derived from approximately 651 million transactions processed through those stores that scanned transactions in both three-month periods.
NRS POS Platform
The NRS platform predominantly serves small-format, independent, retail stores nationwide including convenience stores, bodegas, liquor stores, grocers, and tobacco and sundries sellers. These independent retailers operate in all 50 states and the District of Colombia, including 205 of the 210 designated market areas (DMAs) in the United States, and in Canada. During November 2025, NRS’ POS terminals processed $2.07 billion in sales (+14% year-over-year) across 135 million transactions.