
The TJX Companies, Inc. (NYSE: TJX), the leading off-price apparel and home fashions retailer in the U.S. and worldwide, today announced sales and operating results for the third quarter ended October 29, 2022. Net sales for the third quarter of Fiscal 2023 were $12.2 billion, a decrease of 3% versus the third quarter of Fiscal 2022. U.S. comp store sales (defined below) decreased 2% versus a 16% increase in U.S. open-only comp store sales (defined below) in the third quarter of Fiscal 2022. Net income for the third quarter of Fiscal 2023 was $1.1 billion and diluted earnings per share were $.91. Excluding a tax benefit of $.05 related to the divestiture of the Company’s minority investment in Familia (see below), adjusted diluted earnings per share were $.86. The Company’s third quarter Fiscal 2023 adjusted diluted earnings per share were above plan largely due to a benefit from the timing of expenses, most of which the Company expects will reverse out in the fourth quarter of Fiscal 2023.
For the first nine months of Fiscal 2023, net sales were $35.4 billion, an increase of 2% versus the first nine months of Fiscal 2022. First nine months Fiscal 2023 U.S. comp store sales decreased 2% versus an 18% increase in U.S. open-only comp store sales for the first nine months of Fiscal 2022. Net income for the first nine months of Fiscal 2023 was $2.5 billion. For the first nine months of Fiscal 2023, diluted earnings per share were $2.08. For the first nine months of Fiscal 2023, adjusted diluted earnings per share were $2.22, which exclude from diluted earnings per share a $.14 net of tax charge related to a write-down and the divestiture of the Company’s minority investment in Familia.
CEO and President Comments
Ernie Herrman, Chief Executive Officer and President of The TJX Companies, Inc., stated, “I am very pleased with our third quarter performance. U.S. comparable store sales exceeded our expectations, and overall pretax margin, merchandise margin, and earnings per share were strong. I am particularly pleased with the results at our Marmaxx division, which delivered a 3% comp sales increase, driven by a strong increase in its apparel business. Across our geographies, our values and exciting, treasure-hunt shopping experience continued to resonate with consumers throughout the quarter. Looking forward, while not immune to macro factors, we are convinced that our flexible business model and value proposition will continue to be tremendous advantages, as they have been for more than four decades and through many kinds of retail and economic environments. We are excited about the abundance of deals we see in the marketplace for quality, branded product. Throughout the holiday season, we will be flowing fresh and enticing gift-giving assortments to our stores and online to appeal to our wide customer demographic, and we will be emphasizing our value leadership in our marketing. We remain focused on our long-term vision to become an increasingly profitable, $60-billion-plus revenue company.”
U.S. Comparable Store Sales and U.S. Open-Only Comparable Store Sales
The Company’s U.S. comparable store sales by division in the third quarter of Fiscal 2023 and U.S. open-only comparable store sales by division in the third quarter of Fiscal 2022 were as follows:
| Third Quarter FY2023 U.S. Comparable Store Sales1 | Third Quarter FY2022 U.S. Open-Only Comparable Store Sales2 | |
| Marmaxx3 | +3% | +11% |
| HomeGoods4 | -16% | +34% |
| Total U.S.5 | -2% | +16% |
| 1Comparable store sales exclude e-commerce sites (tjmaxx.com, marshalls.com, homegoods.com, and sierra.com). 2This measure reports the sales increase or decrease of these stores for the days they were open in the third quarter of Fiscal 2022 against sales of those stores for the same days in Fiscal 2020, prior to the emergence of the COVID-19 global pandemic. 3Combination of T.J. Maxx, Marshalls, and Sierra stores. 4Combination of HomeGoods and Homesense stores. 5Combination of Marmaxx and HomeGoods divisions. |
Net Sales by Division
The Company’s net sales by division in the third quarter of Fiscal 2023 were as follows:
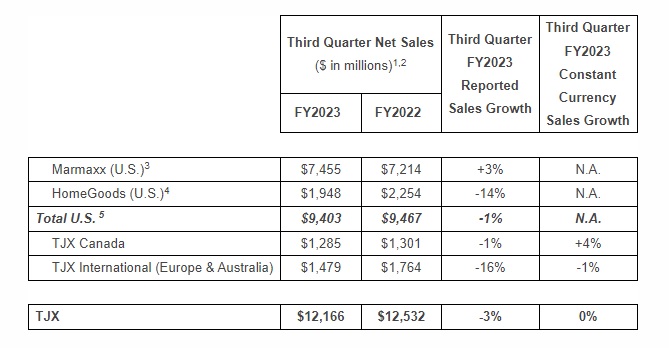
| 1Net sales in TJX Canada and TJX International include the impact of foreign currency exchange rates. 2Figures may not foot due to rounding. 3Combination of T.J. Maxx, Marshalls, and Sierra stores, and tjmaxx.com, marshalls.com, and sierra.com e-commerce sites. 4Combination of HomeGoods and Homesense stores, and homegoods.com e-commerce site. 5Combination of Marmaxx and HomeGoods divisions. |
Margins
For the third quarter of Fiscal 2023, the Company’s pretax profit margin was 11.2% versus last year’s third quarter pretax profit margin of 11.0%. The Company’s above-plan third quarter Fiscal 2023 pretax profit margin was largely due to a benefit from the timing of expenses, most of which the Company expects will reverse out in the fourth quarter of Fiscal 2023. Merchandise margin was flat despite 1.2 percentage points of incremental freight costs. Merchandise margin benefitted from strong markon mostly due to better buying. Incremental wage costs negatively impacted pretax profit margin by 0.8 percentage points.
Gross profit margin for the third quarter of Fiscal 2023 was 29.1%, a 0.4 percentage point decrease versus the third quarter of Fiscal 2022. Selling, general and administrative (SG&A) costs as a percent of sales for the third quarter of Fiscal 2023 were 18.0%, a 0.3 percentage point decrease versus the third quarter of Fiscal 2022.
Impact of Foreign Currency Exchange Rates
Changes in foreign currency exchange rates affect the translation of sales and earnings of the Company’s international businesses into U.S. dollars for financial reporting purposes. In addition, ordinary course, inventory-related hedging instruments are marked to market at the end of each quarter. Changes in currency exchange rates can have a material effect on the magnitude of these translations and adjustments when there is significant volatility in currency exchange rates.
The movement in foreign currency exchange rates had a three percentage point negative impact on the Company’s net sales growth in the third quarter of Fiscal 2023 versus the prior year. The overall net impact of foreign currency exchange rates had a $.01 negative impact on third quarter Fiscal 2023 earnings per share.
The movement in foreign currency exchange rates had a two percentage point negative impact on the Company’s net sales growth in the first nine months of Fiscal 2023 versus the prior year. The overall net impact of foreign currency exchange rates had a $.02 negative impact on the first nine months of Fiscal 2023 earnings per share.
A table detailing the impact of foreign currency on TJX’s pretax earnings and margins, as well as those of its international businesses, can be found in the Investors section of TJX.com.
The foreign currency exchange rate impact to earnings per share does not include the impact currency exchange rates have on various transactions, which the Company refers to as “transactional foreign exchange.”
Inventory
Total inventories as of October 29, 2022 were $8.3 billion, compared with $6.6 billion at the end of the third quarter of Fiscal 2022. Consolidated inventories on a per-store basis as of October 29, 2022, including distribution centers, but excluding inventory in transit, the Company’s e-commerce sites, and Sierra stores, were up 27% on a reported basis (up 31% on a constant currency basis). The Company is very comfortable with its inventory position and is set up extremely well to deliver an ever-changing assortment of exciting brands and gifts to its stores and online this holiday season.
Cash and Shareholder Distributions
For the third quarter of Fiscal 2023, the Company generated $1.1 billion of operating cash flow and ended the quarter with $3.4 billion of cash.
During the third quarter, the Company returned $843 million to shareholders. The Company repurchased a total of $500 million of TJX stock, retiring 7.7 million shares, and paid $343 million in shareholder dividends during the quarter. For the first nine months of Fiscal 2023, the Company returned a total of $2.8 billion to shareholders, which includes repurchasing a total of $1.8 billion of TJX stock, retiring 29.1 million shares, and paying $1.0 billion in shareholder dividends. The Company continues to expect to repurchase approximately $2.25 to $2.50 billion of TJX stock in Fiscal 2023. The Company may adjust this amount up or down depending on various factors.
Divesture of Familia
During the third quarter of Fiscal 2023, the Company completed the divestiture of its minority investment in Familia. As a result, the Company realized a $54 million tax benefit, which increased third quarter Fiscal 2023 diluted earnings per share by $.05.
Full Year and Fourth Quarter Fiscal 2023 Outlook
For the full year Fiscal 2023, the Company is maintaining the high end of its outlook for adjusted pretax profit margin. The Company expects pretax profit margin to be 9.3% to 9.4% and adjusted pretax profit margin to be 9.8% to 9.9%. The Company’s adjusted pretax profit margin plan excludes a 0.4 percentage point negative impact from the first quarter Fiscal 2023 charge related to a write-down of the Company’s minority investment in Familia.
For the full year Fiscal 2023, the Company now expects diluted earnings per share to be $2.93 to $2.97 and adjusted diluted earnings per share to be $3.07 to $3.11. The change in the high end of the Company’s full year Fiscal 2023 adjusted earnings per share outlook is a result of an expected $.02 negative impact due to unfavorable foreign exchange rates. The Company’s adjusted diluted earnings per share plan excludes the negative impact from the first quarter Fiscal 2023 charge related to a write-down of the Company’s minority investment in Familia, as well a third quarter Fiscal 2023 tax benefit related to the divestiture of its minority investment in Familia.
For the full year Fiscal 2023, the Company is increasing its outlook for U.S. comparable store sales and is now planning a decrease of 1% to 2% versus a 17% U.S. open-only comp store sales increase in Fiscal 2022.
For the fourth quarter of Fiscal 2023, the Company now expects pretax profit margin to be 9.5% to 9.8% and diluted earnings per share to be $.85 to $.89. This guidance now assumes that most of the third quarter Fiscal 2023 timing of expenses benefit will reverse out in the fourth quarter of Fiscal 2023. For the fourth quarter of Fiscal 2023, the Company is increasing its outlook for U.S. comparable store sales and is now planning them to be flat to up 1% versus a 13% U.S. open-only comp store sales increase in the fourth quarter of Fiscal 2022.
Stores by Concept
During the third quarter ended October 29, 2022, the Company increased its store count by 57 stores to a total of 4,793 stores and increased square footage by 1.0% over the previous quarter.
| Store Locations1 | Gross Square Feet2 | |||
| Third Quarter FY2023 | Third Quarter FY2023 | |||
| (in millions) | ||||
| Beginning | End | Beginning | End | |
| In the U.S.: | ||||
| T.J. Maxx | 1,290 | 1,295 | 35.1 | 35.2 |
| Marshalls | 1,157 | 1,171 | 32.9 | 33.2 |
| HomeGoods | 862 | 880 | 20.0 | 20.4 |
| Sierra | 62 | 72 | 1.3 | 1.5 |
| Homesense | 40 | 43 | 1.1 | 1.2 |
| In Canada: | ||||
| Winners | 295 | 296 | 8.0 | 8.1 |
| HomeSense | 150 | 150 | 3.5 | 3.5 |
| Marshalls | 106 | 106 | 2.8 | 2.8 |
| In Europe: | ||||
| T.K. Maxx | 626 | 629 | 17.6 | 17.6 |
| Homesense | 77 | 78 | 1.5 | 1.5 |
| In Australia: | ||||
| T.K. Maxx | 71 | 73 | 1.5 | 1.6 |
| TJX | 4,736 | 4,793 | 125.3 | 126.5 |
| 1Store counts above include both banners within a combo or a superstore. |
| 2Square feet figures may not foot due to rounding. |
Fiscal 2023 U.S. Comparable Store Sales
For Fiscal 2023, the Company returned to its historical definition of comparable store sales. While stores in the U.S. were open for all of Fiscal 2022, a significant number of stores in TJX Canada and TJX International (Europe and Australia) experienced COVID-19 related temporary store closures and government-mandated shopping restrictions during Fiscal 2022. Therefore, the Company cannot measure year-over-year comparable store sales with Fiscal 2022 in these geographies in a meaningful way. As a result, the comparable stores included in the Fiscal 2023 measure consist of U.S. stores only, which, for clarity, the Company refers to as U.S. comparable store sales and are calculated against sales for the comparable periods in Fiscal 2022.
Fiscal 2022 Open-Only Comp Store Sales
Due to the temporary closing of stores as a result of the COVID-19 global pandemic, the Company’s historical definition of comp store sales was not applicable in Fiscal 2022. In order to provide a performance indicator for its stores, the Company temporarily reported open-only comp store sales. The Company’s open-only comp store sales calculation includes stores initially classified as comp stores at the beginning of Fiscal 2021. This measure reports the sales increase or decrease of these stores for the days the stores were open in Fiscal 2022 against sales for the same days in Fiscal 2020, prior to the emergence of the global pandemic.


